The CareFlow System offers a comprehensive suite of performance and operational reports designed to enhance transparency, efficiency, and decision-making across your billing and credentialing workflows. These reports provide actionable insights into user productivity, client performance, and system-level efficiency. From identifying biller mistakes and tracking aging accounts to analysing client discrepancies and credentialing progress, each report serves as a critical tool for monitoring tasks, optimising processes, and supporting data-driven management.

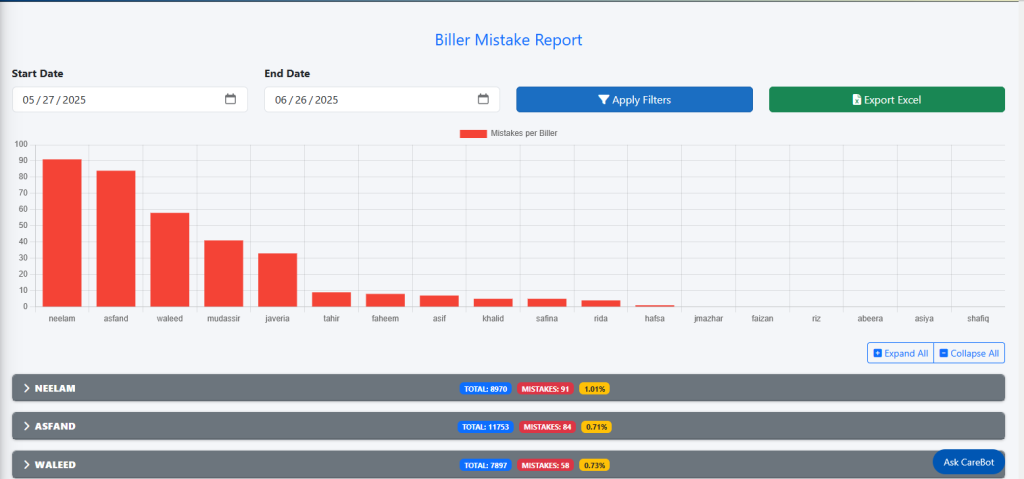
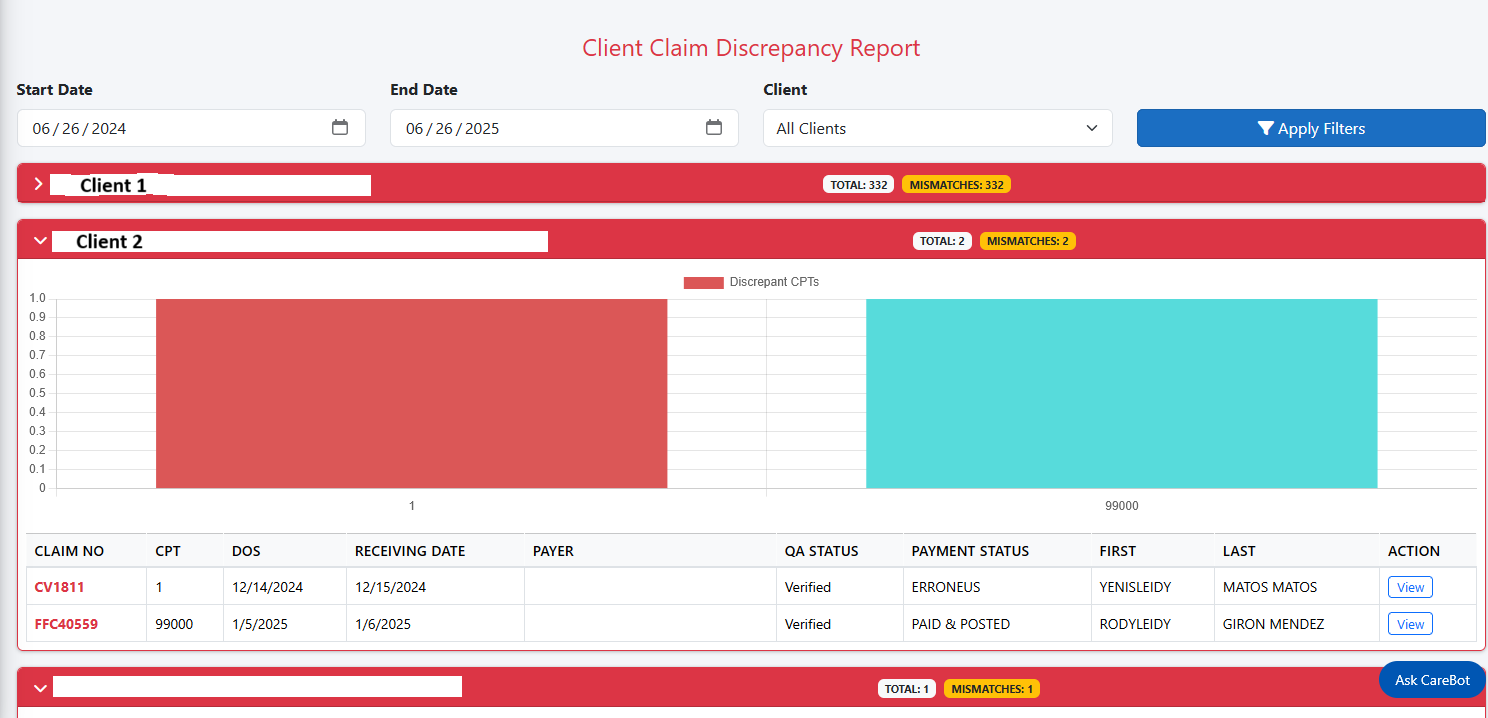
Biller Mistakes Report

Gain clarity on billing errors with this purpose-built report that highlights individual and team-wide mistakes, helping you identify training needs, reduce rework, and improve overall billing accuracy. With powerful visualisations and detailed breakdowns, this report enables targeted performance reviews and operational improvements.

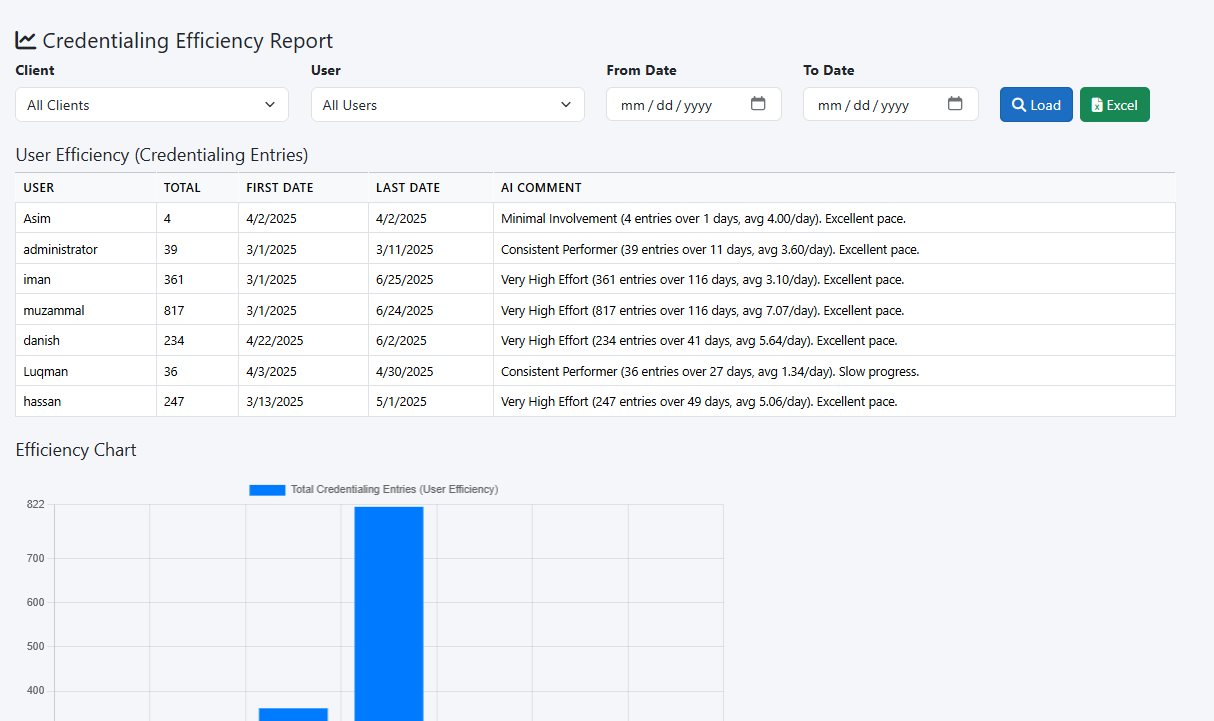
Time-Based Filtering

Easily narrow down mistake trends using Start Date and End Date filters — perfect for weekly audits, monthly reviews, or custom reporting periods.
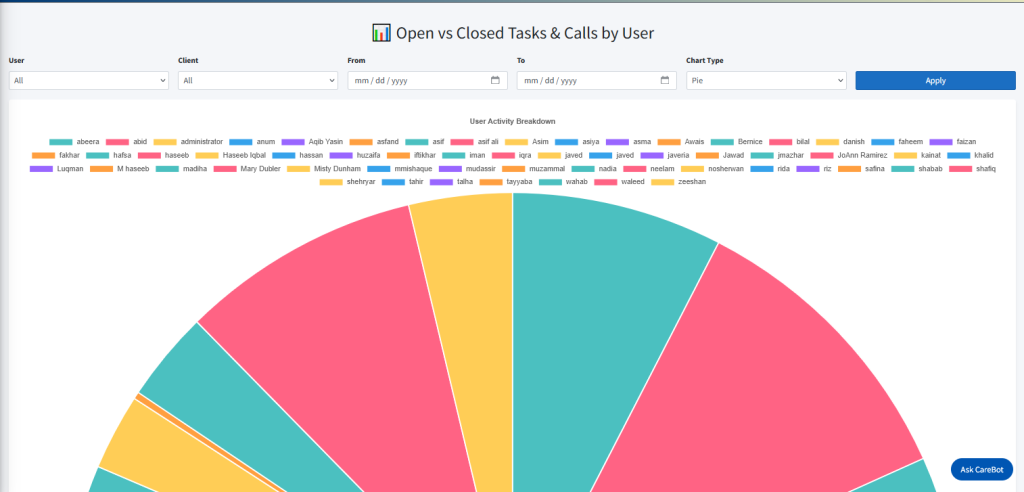
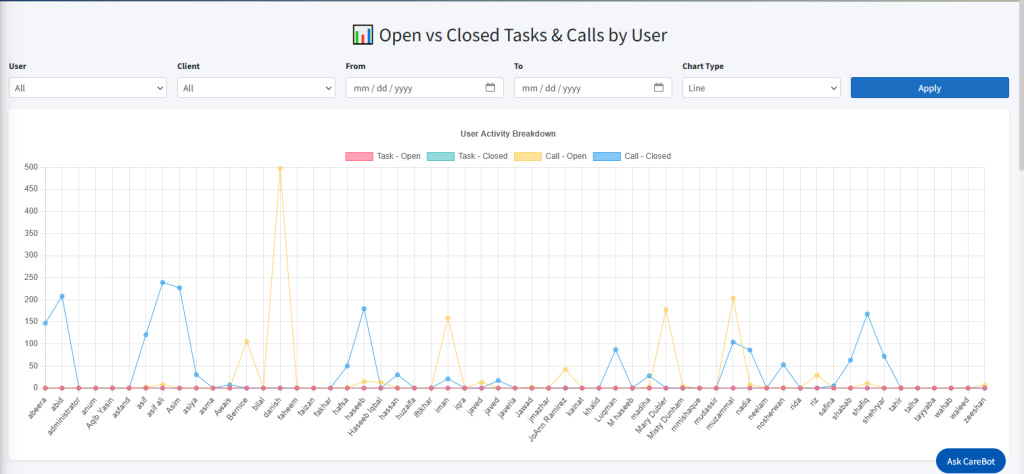
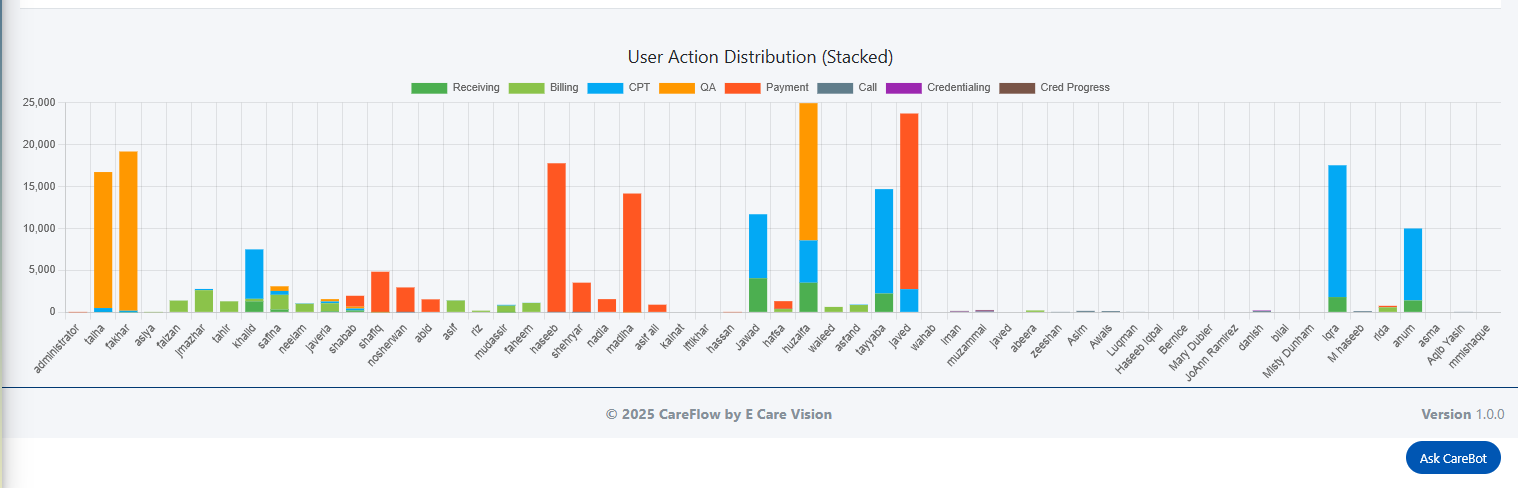
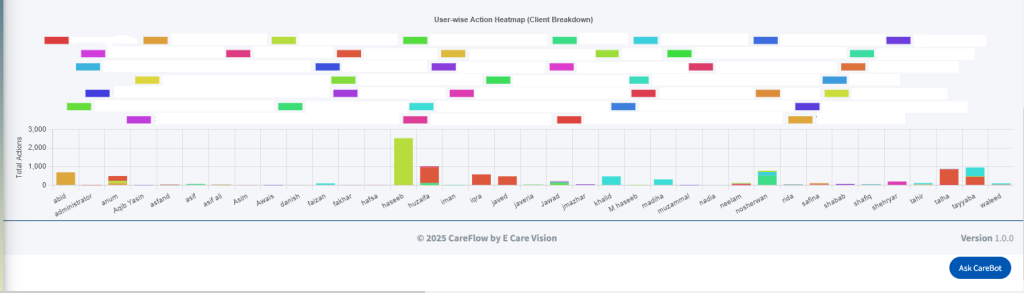
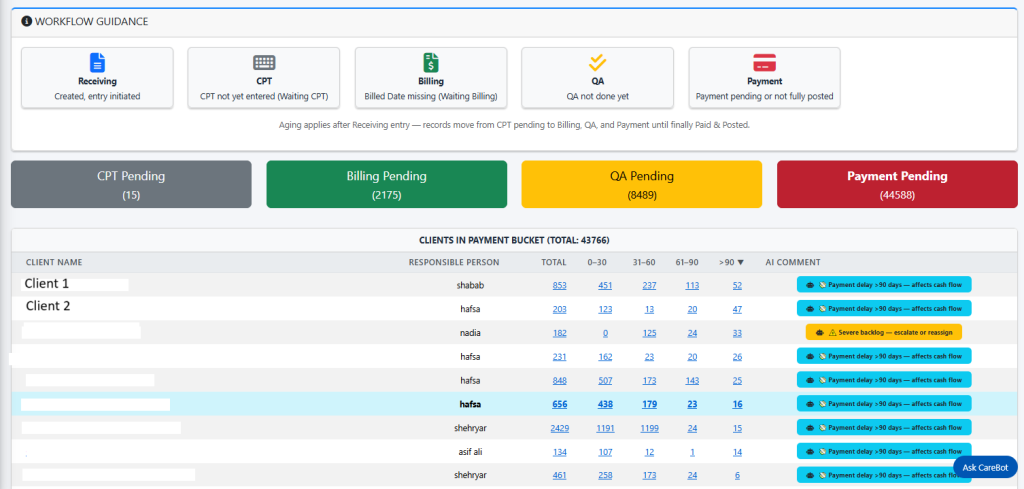
Biller-Wise Graphs

Visualise mistakes per biller with clear, interactive graphs that showcase the volume and distribution of errors — helping you quickly spot outliers and patterns.

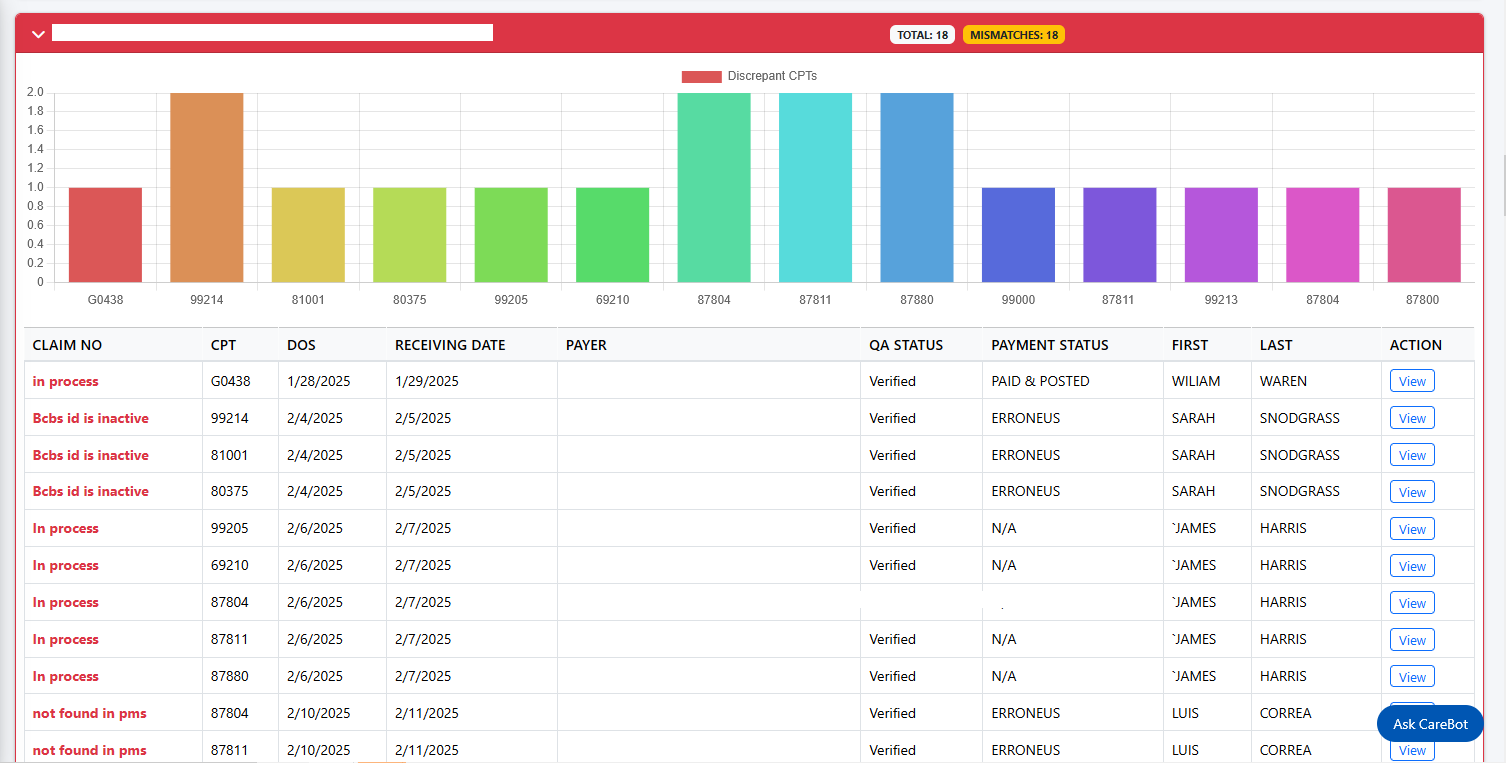
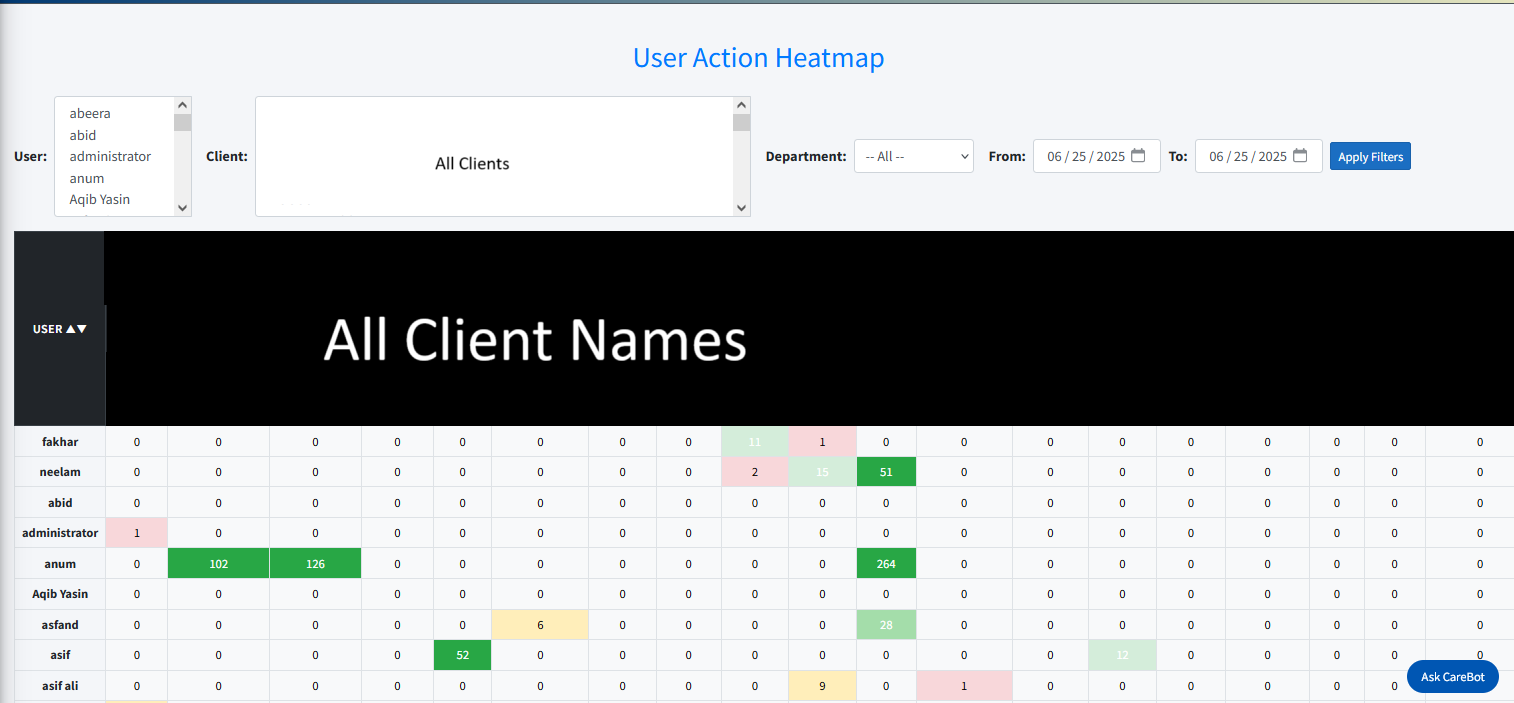
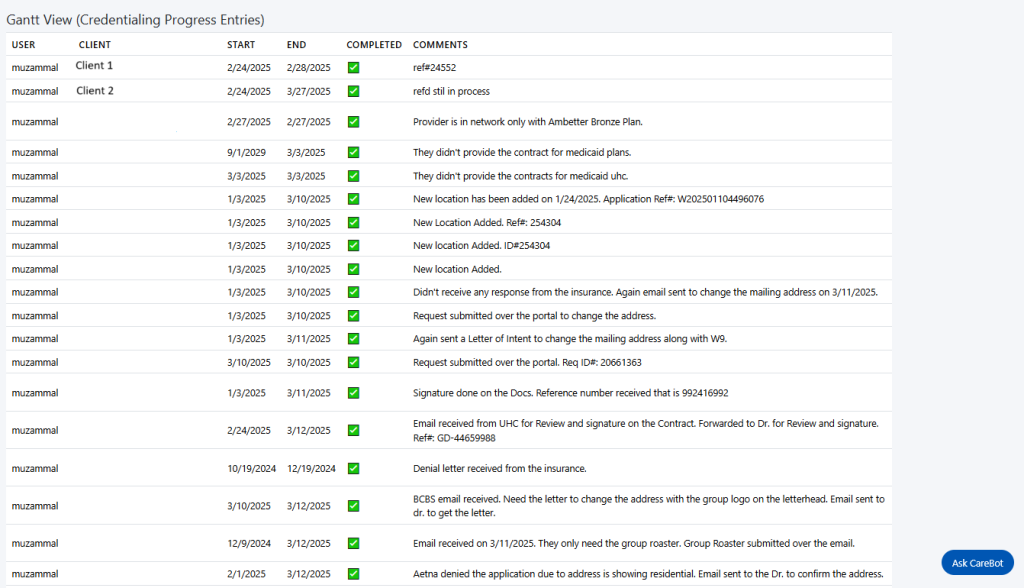
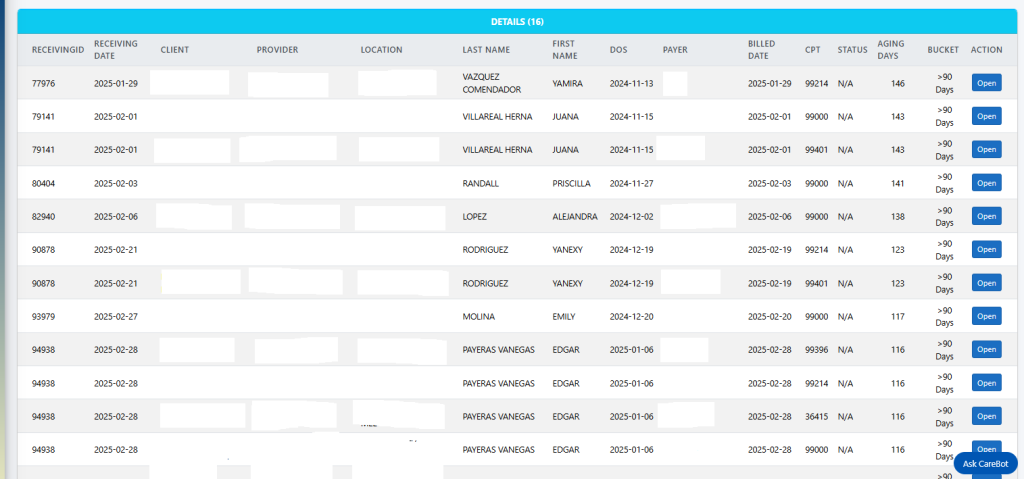
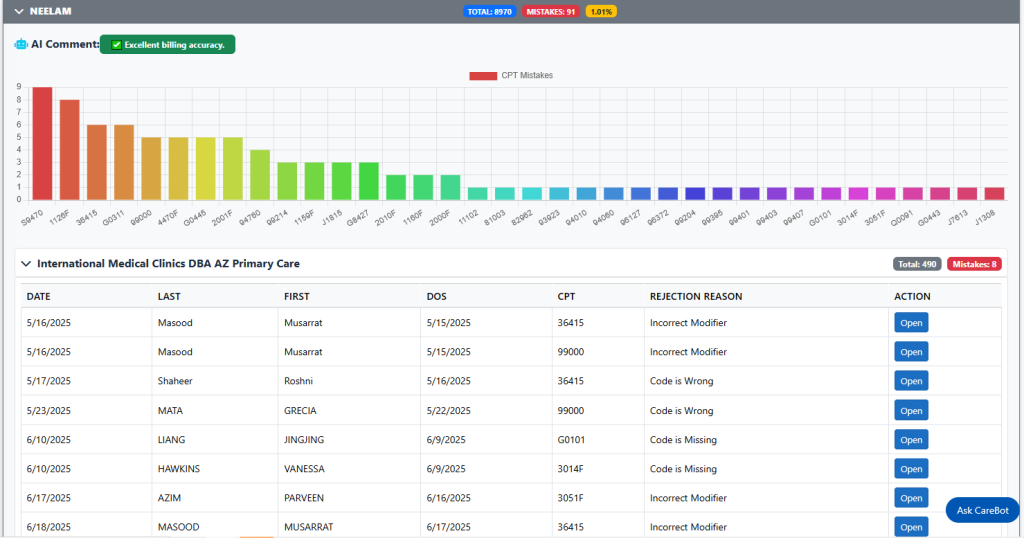
Detailed Mistake Logs

Drill down into specific error types, linked claims, and timestamps — empowering billing managers to take corrective actions and reduce future discrepancies.

Client Discrepancy Report

Date & Client Filtering

Refine your view using Start Date, End Date, and Client filters — enabling targeted checks for specific periods or clients.

Discrepancy Detection

Automatically highlights cases where the ClaimNo prefix does not match the expected Client Abbreviation, flagging them for review.

Detailed Breakdown

View a structured list of all discrepancies with claim details, client associations, and relevant metadata — allowing easy investigation and correction.

Task & Call: Open vs Closed Report

The Task/Call Open vs Closed Report provides a real-time snapshot of user productivity and workload resolution by tracking the status of assigned tasks and logged calls. Designed to enhance visibility across teams and clients, this report helps managers quickly identify bottlenecks, monitor task closure rates, and support timely follow-ups. Flexible filters and chart visualisations make it easy to tailor the analysis to your needs.

User & Client Filters

Narrow results by specific user or client to assess performance, follow-up status, and closure trends within targeted segments.

Custom Date Range

Use the From–To date filter to focus on a defined time period — daily, weekly, or custom windows — to track activity trends over time.

Multiple Chart Types

Choose between Bar, Line, or Pie charts for visualising the open vs. closed distribution — giving you full control over how data is presented and consumed.

Client Summary Report

AI-Powered Comments

Each client’s summary includes auto-generated AI insights, offering intelligent commentary on trends, billing volumes, delays, and follow-up needs.

Compact Overview Format

Presents a clean and structured view of key metrics — including volume trends, follow-up frequency, billing patterns, and QA outcomes — for quick consumption and actionable insights.

Custom Date Range

Use the From–To filter to generate summaries for specific timeframes — ideal for monthly reviews, quarterly meetings, or custom audits.

User-Wise Client Activity Report

The User-Wise Client Activity Report provides a detailed log of user operations across clients and departments, capturing exactly who did what and when — independent of Receiving Date or Date of Service. This report offers powerful multi-filter options and visual performance metrics to help supervisors track workload distribution, team productivity, and client-specific engagement in real time.

Multi-User & Multi-Client Filtering

Select one or more Users, Clients, and Departments (Billing, Credentialing, Night, QA, Payments) to drill down into targeted activity logs across your organisation.

Action-Based Time Tracking

Filter by Start and End Date to review operations within a custom window — showing actual timestamps of performed actions, not just patient service dates.

Performance & Client Metrics

Visualise overall user activity trends in a summary graph, followed by detailed client-wise breakdowns, highlighting contributions and performance per user for each assigned client.

User Efficiency Report

Multi-Filter Options

Select a Start and End Date, choose one or more Users, and filter by Department to view user-specific activity and engagement across targeted workflows.

Cross-Module Action Tracking

Monitor each user’s activity across core modules — including Receiving, Billing, QA, Payment, Call Logs, Credentialing, and Progress Updates — along with total sessions and average actions per session.

AI-Powered Productivity Insights

Each user row includes an AI-generated comment, offering intelligent summaries that highlight performance strengths, anomalies, and areas for potential improvement.

User Action Heatmap Report

The User Action Heatmap provides a granular, client-wise breakdown of user activity across all departments. Designed for operational transparency and efficiency tracking, this report makes it easy to identify who is contributing where, and to what extent. It supports cross-filtering by users, clients, departments, and date ranges, giving management full visibility into workload distribution and performance patterns at a glance.

Comprehensive Filtering

Use Start and End Date, Department, and multi-select filters for User and Client to zero in on specific team contributions within targeted timeframes and service areas.

Client-Wise User Matrix

Each row represents a user, and each column represents a client — showing exact action counts, enabling quick detection of activity gaps, overlaps, or underutilisation.

Heatmap Visualisation

Colour-coded or numerically dense display creates an intuitive “heatmap” effect, making it easy to identify high-performing users, under-engaged clients, or unbalanced task loads across the organisation.

Credentialing Efficiency Report

Client & User-Based Filtering

Quickly refine results using Client, User, and Start–End Date filters — perfect for comparing credentialing performance across team members or tracking changes over time.

Efficiency Chart by User

Visualise Credentialing Entry counts per user with a clean chart that highlights workload distribution and user contribution — enabling data-driven performance reviews.

Gantt View for Credentialing Progress

Track Credentialing Progress entries in a timeline format, showing how credentialing tasks move forward across time — great for spotting delays, overlaps, or gaps in the process.

Aging Report

The Aging Report offers a structured breakdown of claim processing delays across key stages — CPT, Billing, QA, and Payment — helping teams identify bottlenecks and overdue tasks. It provides an in-depth view of outstanding volumes by age brackets, enabling proactive follow-ups and more efficient workflow management. The report also includes AI-generated comments to surface actionable insights and flag critical client-specific issues.

Stage-Wise Aging Buckets

Track pending volumes across CPT, Billing, QA, and Payment, helping stakeholders focus on unresolved claims at every stage of the revenue cycle.

Client-Level Breakdown

Each row lists the Client Name, Responsible Person, total pending count, and distribution across age buckets — 0–30, 31–60, 61–90, and >90 days — supporting targeted follow-ups.

AI-Generated Commentary

Each client includes a smart AI comment that highlights patterns like chronic delays, backlogs, or performance gaps, providing immediate context for corrective action.